Geography 370 provides a general introduction to Cartography, broadly defined as the art, science, and ethics of mapmaking and map use. G370—and the UW Cartography curriculum generally—focuses upon the design of maps, drawing from research and practice on graphic design, information visualization, and semiotics, perspectives that you are unlikely to receive in other GIS courses.G370 is divided into two components: lectures and lab.
My biggest question in taking on this online summer course was "How in the world do you teach cartography online and how do you mimic in person attention, feedback, and community?" Thus far, I've found two things to be help: online live demos that I record and share with my students and Mapping Activities.
I use mapping activities to support students learning and engagement. These activities help overcome technical barriers through weekly practice and help students learn tips and tricks within software. They also provide a space for exploration in a low stake's way and frequently ask students to reflect on their cartographic process. Mapping activities are timed, graded largely by participation, and completed week. Below a provide the goals for each activity and any corresponding material.
Mapping Activity 1: Introductions
Mapping Activity 2: Availibility Poll
Mapping Activity 3: Map Inspiration
Mapping Activity 4: Download Data
Mapping Activity 5: Pick a Projection
Mapping Activity 6: Organize Map Layers
Mapping Activity 7: Trace and Learn Important Tools
Mapping Activity 8: Process Reflection
Mapping Activity 9: Visual Hierarchy and Type
Mapping Activity 10: Create Type Specs
Mapping Activity 11: Apply Type Specs
Mapping Activity 12: Edit Type Placement
Mapping Activity 13: Type Placement Practice
Goal: Introduce yourself!
Prompt: Before the course begins, it would be great to learn a bit about each of you and for you to learn about each other! Please include the following in your introduction:
Name and pronouns (how would like you like be addressed)
A bit about yourself (what program are you in? what are you up to this summer? where will you be taking the course from this summer? what brought you to this course? anything else is great!)
5 keywords, topics, or themes that you'd be interested in mapping this summer
Goal: Check availability.
I asked students use a Doodle Poll to tell me a bit about their availability and when they will be working on course materials. I used this information for live demos and to think about my own schedule.
Goal: Collectively gather mapping inspiration!
Prompt: Upload your favorite map or a map that inspires you. We'll use this as a map inspiration board! Tell us a little bit about the map and why you're drawn to it. Be sure to cite the map!
Goal: Practice downloading and unzipping spatial data!
Goal: Describe an appropriate map projection for a map scenario!
Goal: Correctly open an Adobe Illustrator file that was exported from ArcGIS. Organize and rename your map layers!
Goal: Explore important tools (pen, pencil, shape, and area type tools) and learn to trace in Adobe Illustrator!
Goal: Write a reflection about your Lab 1 process!
Prompt: In many ways, cartographic process is more important than the final output. Articulating your process in writing forces you to critically reflect on the work that you've completed. You may find moments of brilliances and opportunities for improvement, but either way, it directly helps your next project. This also helps me grade your labs more fairly!
Write and submit a reflection (250–500 words submitted to Canvas as a PDF) on your process for Lab 1. Please highlight each step of your cartographic design process from data collection, generalization, symbolization, design, maps edits, etc. Record your software workflow along with any discoveries and challenges faced in the lab exercise. Be transparent, reflexive, and comprehensive.
Goal: Use the Character Panel in Adobe Illustrator and what you’ve learned about type to create a visual hierarchy and customize a personal business card.
Goal: Using what you’ve learned about type, create a type specification sheet by assigning type styles to map features.
Goal: Apply the type specs that you created in Mapping Activity 10 to a pre-fabricated map!
Goal: Edit the type placement of an existing map!
Goal: Practice placing type for point, line, and area features!
I taught and redesigned Geography 572 this past fall and I used this online format to record, take notes, and provide resources. Below I share my teaching philosophy and strategies, reflections, syllabi, assigned readings, resources, and materials that I created. I would love any feedback!
Week 1: Welcome and History of Cartography
Week 2: Visual Storytelling and Mapping
Week 3: Visual Storytelling and Data Journalism
Week 4: Perception and Visual Enhancement
Week 5: Visual Complexity and Terrain
Week 7: Cognition and Semiotics
Week 11 and 12: Feminist Cartographies
Geography 572 (G572) provides an in-depth examination of advanced themes and topics in cartographic design. G572 is an extension of the G370 course, but with a focus on cartographic design for the web rather than print and the intersection of cartographic design with graphic design, web design, and the digital humanities. Specifically, G572 integrates theory (new ways of critically examining cartography) and practice (cartographic implementation) emphasizing the design of webdelivered static maps, rather than the design of interfaces for manipulating these maps.
My current syllabus and course schedule is available here.
Inclusion and engagement are key components of my teaching philosophy. As such, we embrace all students, including and especially: people of color, LGBTQIA people, non-citizen residents (of any status) and Native Americans, Muslims, Jews, and members of all other faiths, atheists & agnostics, women, disabled people, and disaffected people. We will actively work to ensure that everyone is welcome and is invited to share their perspectives. We will respect and support one another.
I'm still working on fostering an inclusive environment. Below are my current strategies and I would love suggestions!
Classroom layout: I arrange the seats into a circle / u-shape.
Name plates: Each students has a name card on displayed on her/his/their desk.
Remembering names: I had out each name plate at the beginning of class.
Avoiding the podium: I limit my time in front of the class lecturing. I prefer to sit in the circle with my students.
Preparation: Students are asked to come prepared to class having read/viewed the assigned material. At the beginning of class, I provide prompts and have students take a few moments to write down their thoughts on the assigned readings. I hope this helps spur conversation and increase engagement with the material
Students are asked to complete a series of readings before class on Wednesdays. The readings address the topic or lens for week in a variety of ways. My goal is to combine academic articles with additional and alternative sources of knowledge. For example, I may ask students to read blog posts, tutorials, and news articles. I also aim to incorporate other multimedia sources like videos or to review existing maps.
As mentioned above, students are assigned reading material that directly relates to the cartographic theme of the week. In class, they are asked to write a short reflection about the assigned readings and theme of the week. I provide questions or prompts to get students engaged in thinking and writing. To receive full credit, students come to class prepared having read or watched the assigned materials. Additionally, the free writes encourage and help guide class discussion.
In this class, students help curate course material by submitting map examples, graphics, articles, videos, or material related to the course. I provide prompts and ask students to submit a related object each week before class (usually Fridays). Students submit each object online and come to class prepared to talk about their objects!
Lecture activities take a variety of shapes, including class discussions of readings, critiques, peer feedback, group work, and mapping exercises. Fridays are reserved for activities and are generally held in the lab room. The goal is to learn from each other and learn from “doing”. In mapping exercises, for example, students will put cartographic themes from assigned readings, discussions, and my lectures to practice. Additionally, extra lab experience benefits their cartographic skills development.
I should note that the activities mentioned above are in addition to traditional lab assignments. I also save time for a bit of lecture. I'm not going completely rogue (yet)!
Critically examine maps and mapping through transdisciplinary lenses by reading, writing, and actively discussing
Translate cartographic theory into cartographic practice through process, experimentation, critique, and feedback
Enhance your cartographic skillset through advanced cartographic techniques and technologies
Create an online web portfolio to show off your work
Discover your cartographic self and what mapping means to you
"How Mapping Became Scientific" in Mapping: A Critical Introduction to Cartography and GIS, Jeremy Crampton
"The Political History of Cartography Deconstructed" in Mapping: A Critical Introduction to Cartography and GIS, Jeremy Crampton
The Hidden Histories of Maps Made By Women: Early North America, Laura Bliss, CityLab
#NoDAPL, Carl Sack
What are your expectations for the course?
What are your career goals?
Are there any topics from Geography 370 (Intro to Cartography) that you feel unsure about and would like a review?
Is there anything I should know about you before the semester begins (i.e. accommodations, conference travel, expected absences)?
What was familiar or a review about the histories presented in the readings? What was new?
What and who was missing from the readings?
To what extent, does Robinson’s scientific approach to mapping and the communication model influence cartography today?
How is cartography changing? Who’s in control of mapping?
By default, maps are political and powerful objects. As a result, the very definition of a map matters. To receive full credit for this assignment, I asked students to submit to a discussion post a definition of a map. This can be in their own words or can be borrown from someone else (as long as they give recognition).
Students then used these definitions in the Lecture Activity below.
For this Lecture Activity, students were paired up to introduce and discuss their Object or map definitions. I asked them to compare similarities and difference in terminology as well as the connotations produced by each definition.
I combined all Objects or map definitions into one word cloud and as a class, we narrowed down a few working definition. The goal was not prescriptive. I wanted students to think about their own perspectives and the assumptions within their experiences as cartographers.
One of the best pieces of this class is the fact that it's an upper-level course. Everyone in class is in there for a reason. There's a mix of students from undergraduates to certificate students. They have all taken Intro to Cartography (Geog 370), but with varying teachers and varying perspectives. All in all, there is a ton of excitement! The students are ready to go!
The first day of class (Wednesday) was the typical "syllabus day". After going through course content and goals, we did a round of introductions and spent time on Free Write #1. This was a really good way to get to know students quickly without the pressure of verbal introductions.
On Friday, we jumped right into course material beginning with Free Write # 2. Class discussion on the assigned readings was a bit rough, but I think that might be a remnant of the first week of class. It's something to keep an eye on though. We then moved to the lab for this week's Lecture Activity. The best part of the Lecture Activity was the buzz of students talking and working together. Regardless of actvity's actually outcome, this was awesome to see!
Lecture Activity Worksheet Example
Cartography I: Mapping Narrative Cartography, Sébastien Caquard
Framing the Days: Place and Narrative in Cartography, Margaret Pearce
A Rogue State Along Two Rivers, New York Times
An Infamous Day, Esri Story Maps
Hurricane Harvey Post Event Imagery, Esri Disaster Response Program
How are maps and stories related?
Caquard differentiates grid maps and story maps. How are they similar or different?
What are your thoughts on the assigned maps from Pearce, The New York Times, and ESRI Story Maps? Do they tell stories?
What narrative mapping techniques did Pearce use?
Maps have a long and interconnected history with stories and narrative. Most recently, however, story maps, visual storytelling, and narrative have become buzz words in cartography and data journalism (among many other fields). For this Object assignment, I asked students to upload one of their favorite story maps, narrative maps, or any map incorporated into a story.
Students then used these map examples in the Lecture Activity below.
Lecture Activity Worksheet Example
I really had fun this week in class because my work has always been inspired by the inclusion of stories and narratives in cartography. I'm particularly inspired by Sébastien Caquard and Margaret Pearce's (my former advisor at the University of Kansas) work. Discussion with students this week was easy. Stories and narrative are buzz words in contemporary cartography and whether or not they read the material, they had plenty to say. Students also seemed very interested in the story-esque maps that I provided as assigned readings. We explored the similarites and differences in narrative and storytelling techniques across the examples. We then dove more closely into Margaret Pearce's techniques in Framing the Days.
One pedagogical question arose this week, "what is the role of required reading?" I don't have any exams, but I do have short quizzes on all readings, discussion, and lecture material. The only way I really gauge their reading, however, is through Free Writes and discussion in class. I try to avoid completely regurgitating the readings in my lecture. In some ways, students just "miss out" on related material if they haven't read.
Furthermore, I try to provide at least two Free Write prompts that are directly related to the assigned readings and two that are more open ended. This allows those who didn't read to participate and engage in thought, in writing, and in conversation. I personally think the readings supplement and add to the discussion in numerous ways, but I'm definitely bias given my interest in the material. I hope to provide relevant and interesting readings from various outlets (not just academic articles, but blogs, maps, news articles, tutorials, videos, etc.) I know others who do not have any assigned readings. I know other who don't assign any readings or text. Long story short, should I care if students complete the readings?
The Object assignment and Lecture Activity this week asked students to submit their favorite story or narrative map examples. We then explored and documented specific storytelling and cartographic techniques that were used in the map examples. Students worked in groups of two or three, which I highly suggest. Students jumped right into the Lecture Activity and were able to talk through the map examples together. Also, this cuts grading in half, which is a major win for me! I plan on creating a composite list of the techniques, so stay tuned!
In other news, I've discovered that I trip on nearly everything when I teach. The comedic relief comes in handy.
This week's lecture activity was inspired by Storytelling with Data.
Data Example for Adobe Illustrator
So What?, Cole Nussbaumer Knaflic from Storytelling with Data
2014 The Year in Interactive Storytelling, Graphics and Multimedia, New York Times
WTF Visualizations, @WTFViz
Storied Maps, Mark Denil
In So What?, how does the author differentiate from story and Story? Furthermore, what is the goal of story in data journalism?
How could you make this graphic more effective?
How do maps fit in to The Year in Interactive Storytelling, Graphics and Multimedia examples?
Thoughts on the Denil piece? Do you buy his argument?
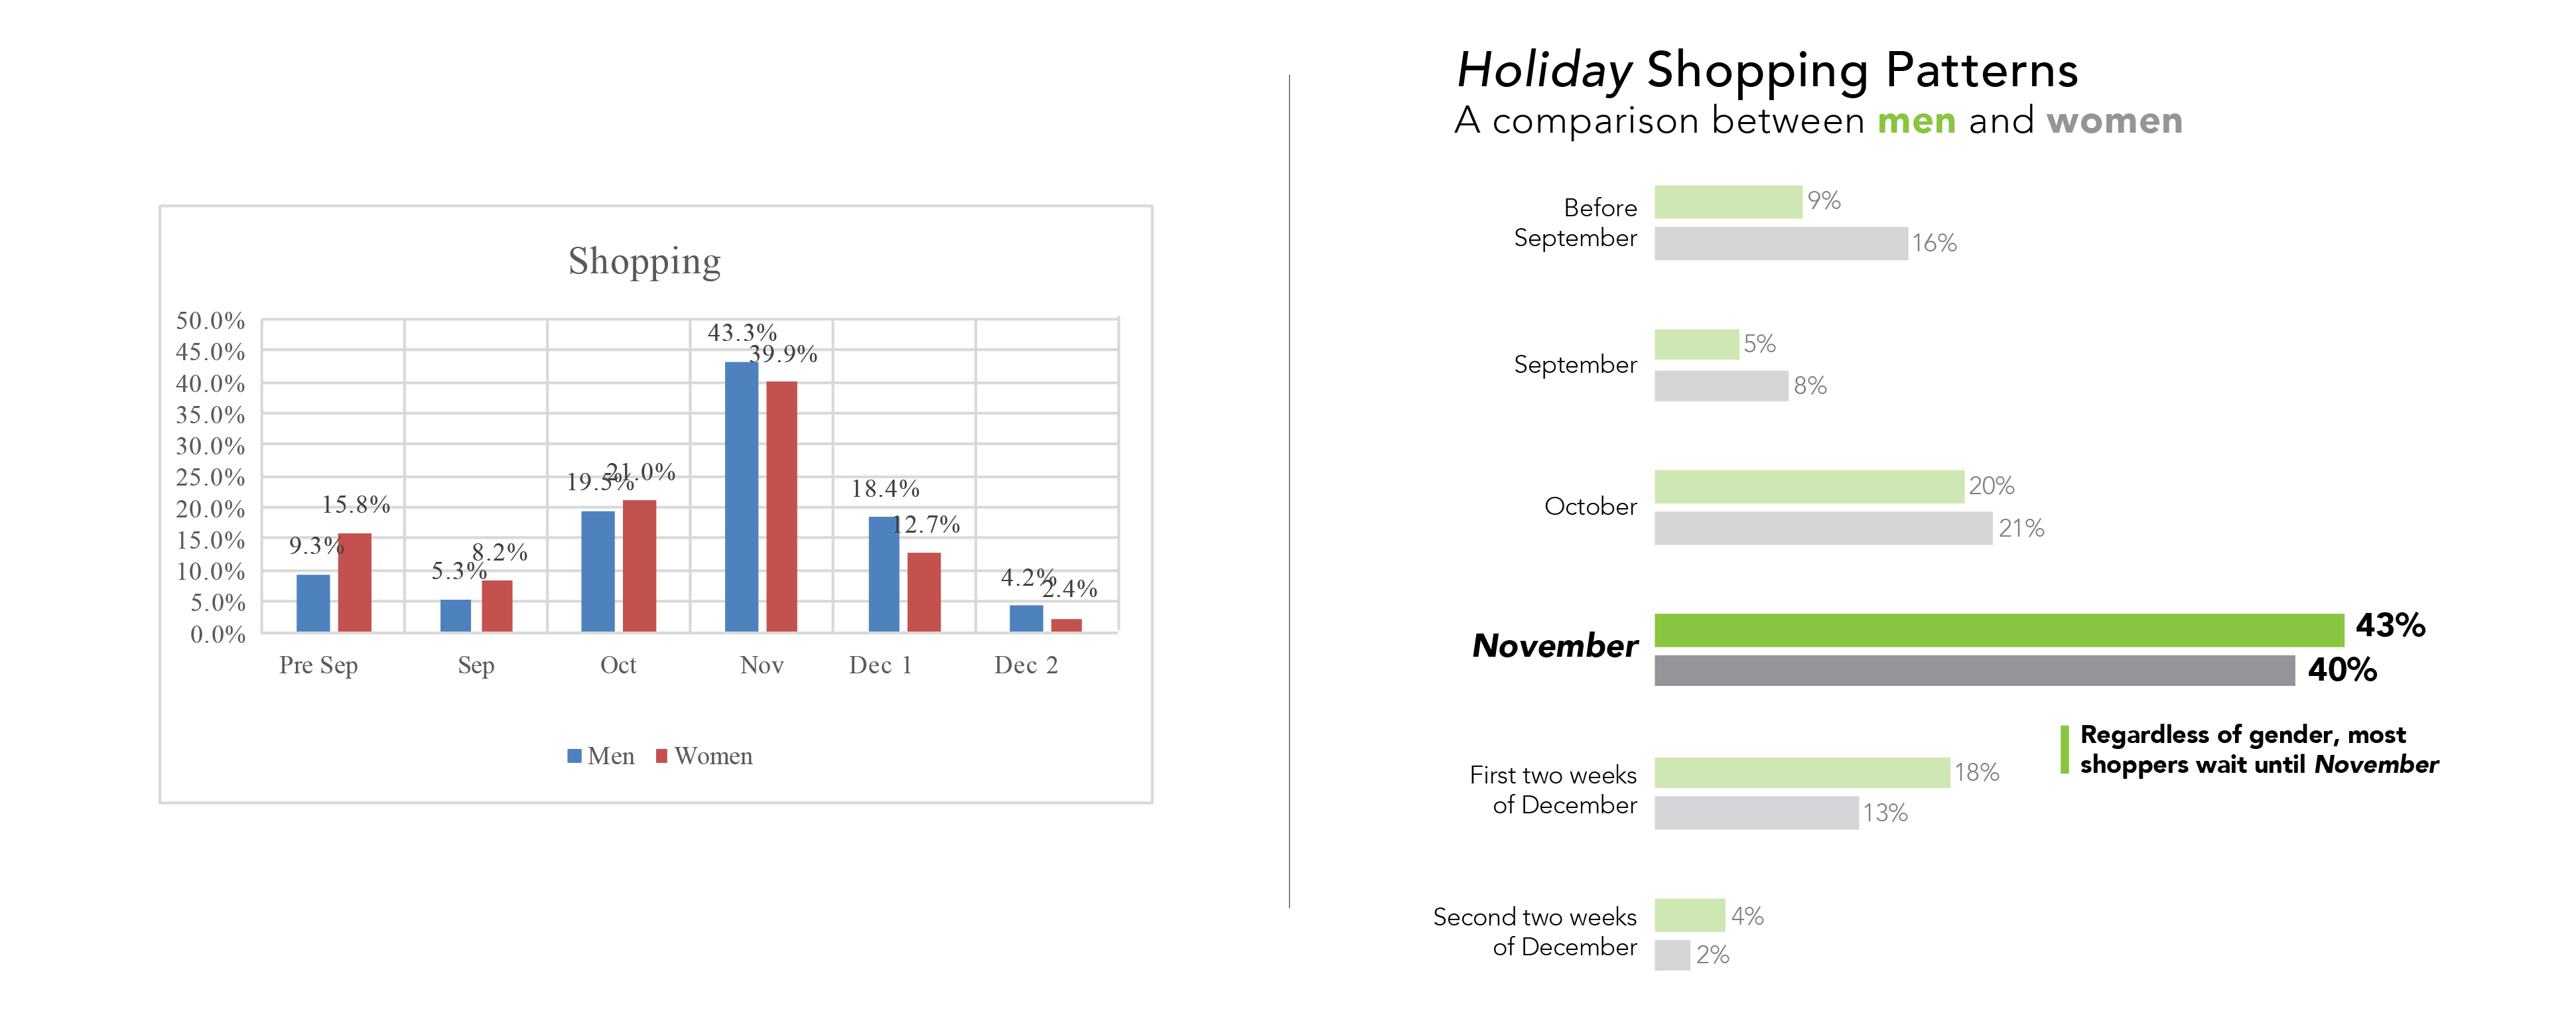
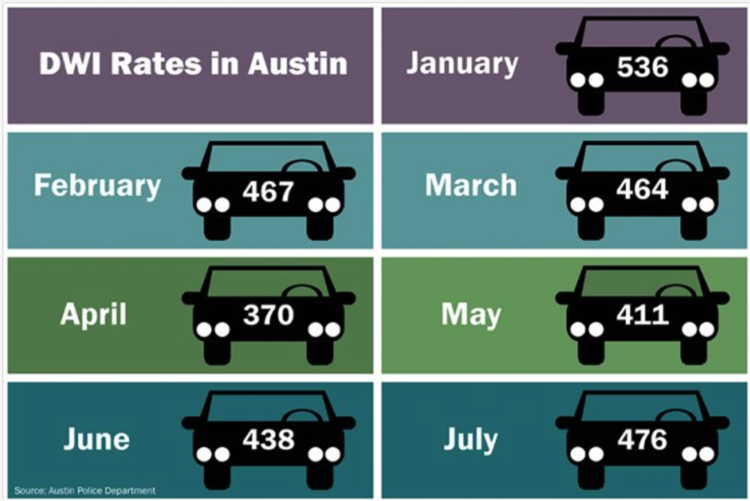
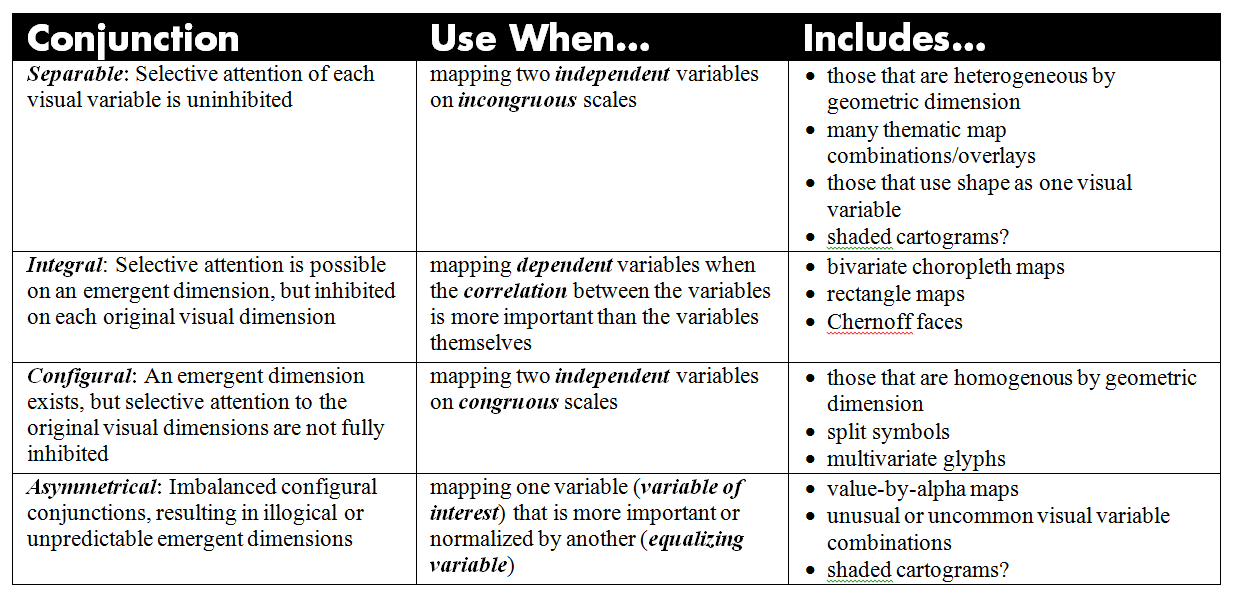
In addition to visual storytelling and data journalism, we explored bivariate and multivariate maps. I asked students to submit bivariate and multivariate map examples as their Object for this week. After completing the lecture activity below, we discussed strategies for successful map design using two or more datasets. Drawing on Marty Elmer's master's thesis, we discussed separable, integral, configural, and assymetrical bivariate map types and when to use them!
Keeping the theme of this week in mind, the goal is to effectively and efficiently tell a multidimensional story with data.
This week's lecture activity was inspired by Storytelling with Data.
Data Example for Adobe Illustrator
"An Information-Processing View of Visiona and Visual Cognition" in How Maps Work: Representation, Visualization, and Design, Alan MacEachren
"How Maps are Seen" in How Maps Work: Representation, Visualization, and Design, Alan MacEachren
"Color Design for the Color Vision Impaired" in Cartographic Perspectives, Bernhard Jenny and Nathaniel Vaughn Kelso
This week's Free Write focused on the first lab assignment. Students are creating a longform infographic and are asked to utilized visual storytelling techniques to effectively convey a narrative. They are asked to include a bivariate map. As such, we used this Free Write as a "check in". This helps the students solidify their topic and data sources. Additionally, this allows us (the TA and I) to better understand individual progress as well as any issues that have arisen.
What is the central argument or storyline in your Lab 1?
What two datasets are you using for your bivariate/multivariate map?
Are your datasets separable, integral, configural, or assymetical?
Which bivariate map combination makes sense for your data?
What software program are you in (ArcMap or Illustrator) and what are your next steps?
This week, I asked students to submit their final project (or another map) from Geography 370, our intro to cartography course at UW–Madison. Students used this map Object in the lecture activity on Friday. I have found that revisiting and critically examining maps that I've created in the past is extremely helpful. After you get over the "what in the world was I thinking", this can be really productive. Taking a break and returning to past work is refreshing because when you're deep in the work itself, it's hard look beyond the page. Additionally, I want students to get in the practice of revisions. At the end of the semester, they will put together online portfolios. By digging up their old projects, I hope they edit and post them online as something to be proud of.
This lecture activity could be split into two. I was hoping students would have enough time to actually edit their map, but we ran out of time. Instead of editing the map, I had students reflect on potential strategies for future edits.
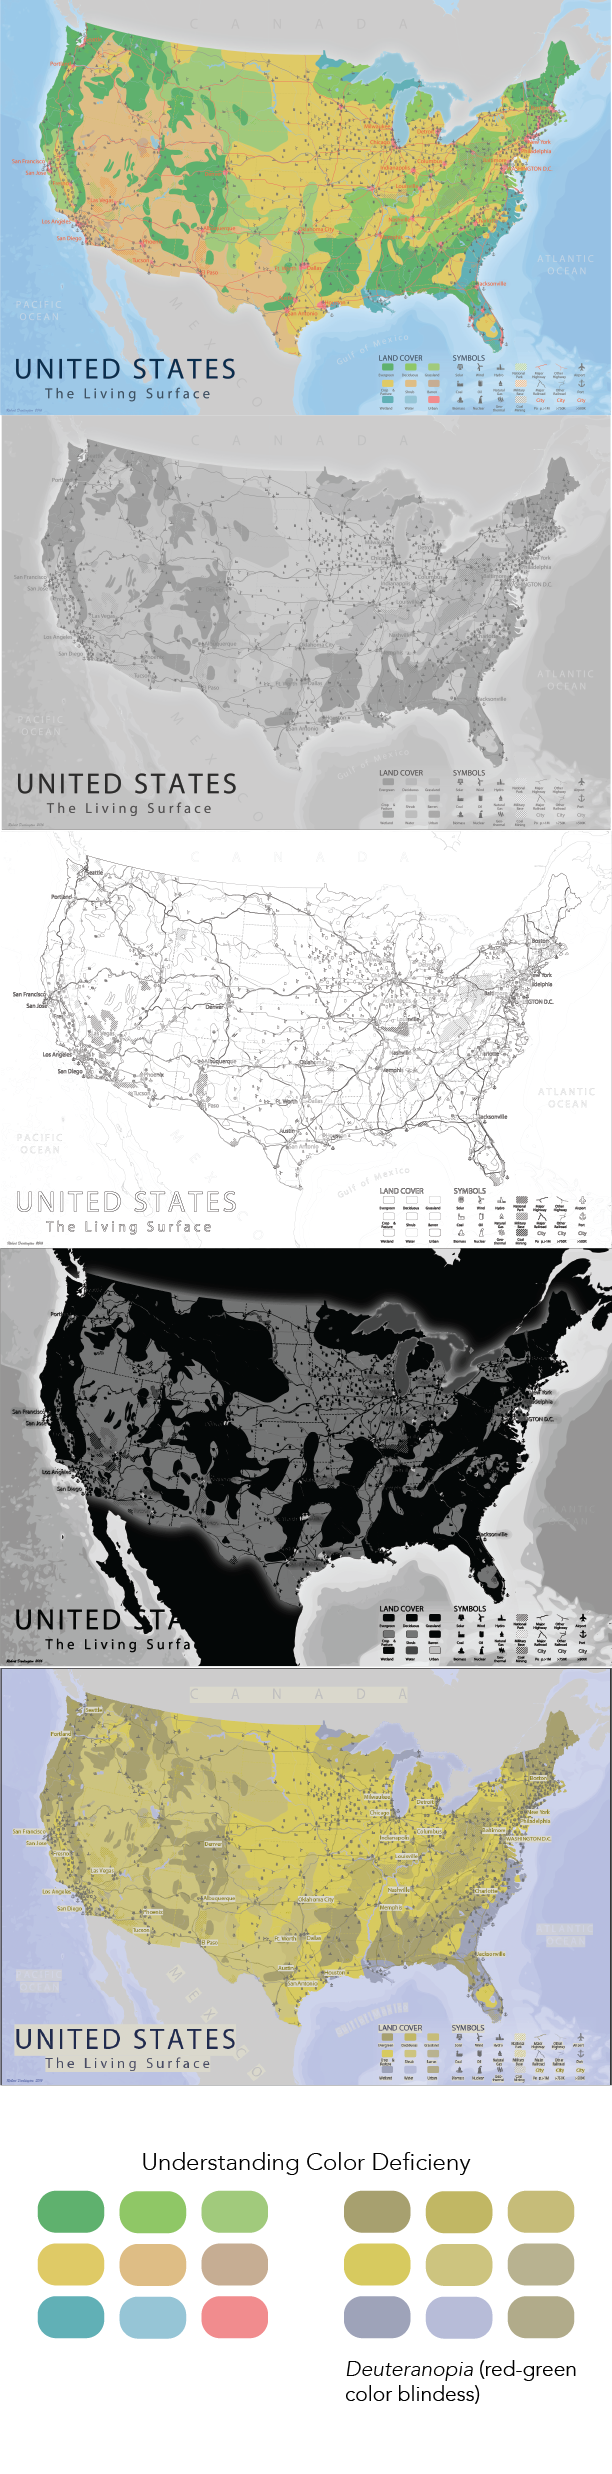
This week was really fun! I planned this week's Lecture Activity early this summer after listening to Daniel Huffman's ICC presentation on the Ecological Atlas of the Bering, Chukchi, and Beaufort Seas. If you haven't seen the atlas yet, you should really check it out. It's absolutely stunning. During his talk on cartographic design for marine maps, Daniel focused heavily on universal and effective design for the color impaired. Daniel views such design as an ethical requirement that emphasizes inclusion. Roughly eight percent of the population is effected by some type of color deficiency and as visual designers, this is something that needs to be taken into account. And to be honest, this is something I haven't always prioritized. As such, I built a portion of the Lecture Activity around design principles for color impairment.
I should probably back up a bit though. Our lens or theme for the week was perception and to be honest (again), this lecture was a lot to take in when I took the class. When I took the course, one of the primary text's was Alan MacEachren's How Maps Work. How Maps Work is a fantastic and comprehensive text that interrogates how maps are seen, how they are understood, and how they create meaning. It is also extremely rich, yet dense and for me, it was difficult to digest in large chunks. As such, I had students review the text and after our Free Write, I lectured for a good portion of the class. This isn't something I want to do very often, but I wanted to outline key points and take aways from the text. We defined perception and explored vision, the eye, eye-brain physiology, visual stimuli, and Marr's theory of vision. We linked Marr's theory of visions (a series of abstractions of the visual scene) to cartographic principles such as contrast, grouping, and figure/ground. We are going to wrap up our notes on gestalt principles and grouping this week.
This week took more prep than normal for me. I found that I was a little uneasy with the topic and doubted my ability to explain these concepts effectively. After rereading How Maps Work and Rob Roth's lecture, I turned to good old YouTube. I watched a series of lectures from psychology 101 courses and physiological descriptions of the eye and image processing. All in all, I think it went fine and it was actually fun. Going back through this material really helped ingrain why perception is so important. Of course vision can be deceptive and perhaps limiting if we look at it in isolation, but incorporating a perceptual lens in our cartographic work can be really useful! It might take a few reviews to let it sink it though.
Students also played around with color vision impairment filters in Photoshop and Illustrator this week in the Lecture Activity. I also finally downloaded Color Oracle. You should definitely check this one out! Thanks for checking in!
I asked students to submit their favorite terrain map for this week's Object. Students used these maps in the Lecture Activity on Friday. In Lab, they are designing their first terrain map, so I wanted them to be exposed to high quality and unique terrain examples. The discussion thread turned into an effective inspiration board! I will posted a few examples asap.
This week was a little crazy for a number of reasons. Students completed an open note quiz on Wednesday and they had their first lab (a longform infographic that includes a bivariate map) due. As mentioned, the quiz was open note and covered anything and everything from the first five weeks of class. It was worth 10 points and included multiple choice, true/false, matching, definitions, and short essays. Overall, I thought the quiz was pretty fair, but the grades were lower than I expected. There were several students that did really great, a few in the middle, and a few on the lower end. My goal was for students to review their own notes and my lectures notes which are posted online hoping the material would sink in and stay. I framed the quiz as 'free points' because it relied on notes and attendance. Are open note quizzes really 'free points'? Furthermore, are open note quizzes useful for reviewing past materials if students don't take it seriously? Am I overthinking it because I want everyone to do well? Everyone will do better next time with one under their belt, right?
This week I introduced visual complexity as it relates to visual perception. Visual complexity, information density, and visual overload all directly effect perceptual understanding of the map. We discussed a variety of factors that influence visual overload. Bivariate maps, for example, increase the complexity of the page by asking viewers to digest more than one variable simultaneously. Additionally, the number of features on the map impact map comprehension. We examined visual complexity in thematic maps and infographics that seek to remove all extraneous information. In contrast, reference maps, particularly those that include terrain, seek infomation density and in turn, increase visual complexity.
On Friday during our Lecture Activity, we dove into terrain mapping technqiues. Terrain provides increasing realism and hyperrealism and allows viewers to connect with/recognize the landscape. Let's be real though. Terrain is sexy. Viewers (and cartographers) really like terrain, but it's also reallydifficult to create clear visual hierarchy and figure/ground. To help students plan ahead for their second lab, a terrain reference map, students explored the intellectual and visual hierarchies depicted in the terrain maps submitted as Objects. They then created their own symbol/type specification sheet (spec sheet) to help guide their own design. I found this Lecture Activity to be really helpful. Some students took it more seriouesly than others. For many, this was their first time looking at a map layer by layer to better understand the visual hierarchy at play. I hope this activity directly informs their upcoming lab.
This week was also busy because I was preparing for NACIS and trying to get ahead for the class. I am super fornuate though because I have a great TA that ran the show while I was gone. I was able to get some grading down while gone, answer a few emails, and now I'm stuck in Toronto updating this website! Stay tuned for a NACIS recap. As usual, I'm extremely exhaustive after the conference and workshops, but I learned a ton! I look forward to incorpoatomg new tools and techniques into the class!
This week I was at NACIS or the North American Cartographic Information society meeting in Montréal, Canada. NACIS is an incredible community of academic and industry cartographers. I cancelled my lectures (lab was still held) and spent the week learning from amazing cartographers and their inspiring work. I participated in Practical Cartography Day on Tuesday, which consists of short demo/tutorial presentations as well as the main conference. I gave a presentation called Humanzing Maps with my colleagues Nick Lally and advisor, Rob Roth. I wrapped up the week with some poutine and a Critical GIS workshop at McGill University. All in all, it was a great week.
"Cartographic Design and Aesthetics FAQ", Alexander Kent, Kenneth Field, Bernhard Jenny, and Anja Hopfstock
"Expressive Map Design Based on Pop Art: Revisit of Semiology of Graphics?", Sidonie Christophe
"Type on Maps: All the Little Things that Actually Matter", Elaine Guidero
"If Looks Could Kill: The Impact of Different Rhetorical Styles on Persuasive Geocommunication", Ian Muehlenhaus
"At the Intersection of Maps and Emotion: The Challenge of Spatially Representing Experience", Amy Griffin and Julia Mcquoid
Bio Mapping / Emotion Mapping, Christian Nold
"Deconstructing the Map", J.B. Harley
"The Detroit Geographic Expedition and Institute: A Case Study in Civic Mapping", Catherine D'Ignazio
"William Wheeler Bunge: Radical Geographer (1928–2013)", Luke Bergmann and Richard Morrill
Part 1: Lecture Activity Handout
Part 2: Lecture Activity Handout
"Is GIS for Women? Reflections on the Critical Discourse in the 1990s", Mei-Po Kwan
"Feminist Data Visualization", Catherine D'Ignazio and Lauren Klein
Map Poetry, Lisa Rost
Designing for Other (Than Straight, White, Rich Men), Catherine D'Ignazio